Posted on February 23, 2020 at 11:47 a.m.
Project 1 for Physical Computing and Alternate Interfaces. We were tasked with using two inputs to control an LED output in a non-trival way. I found the temperature sensor interesting, so I used that to display the data collected. I took inspiration from Giovanni Carrera's project, where he made an accurate LED thermometer.
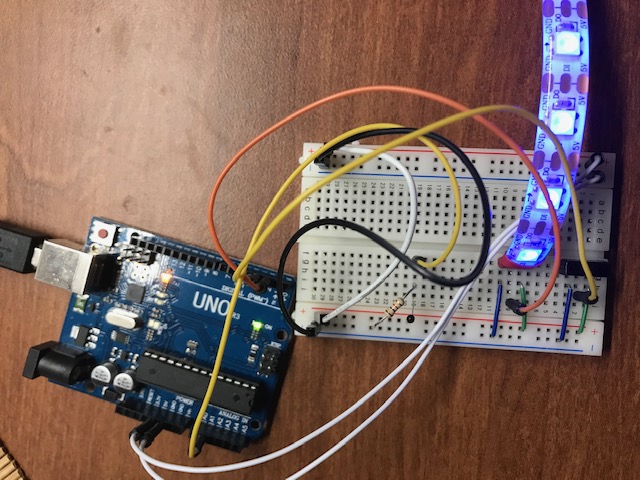
The first way I displayed the data on the LED strip was through colors.
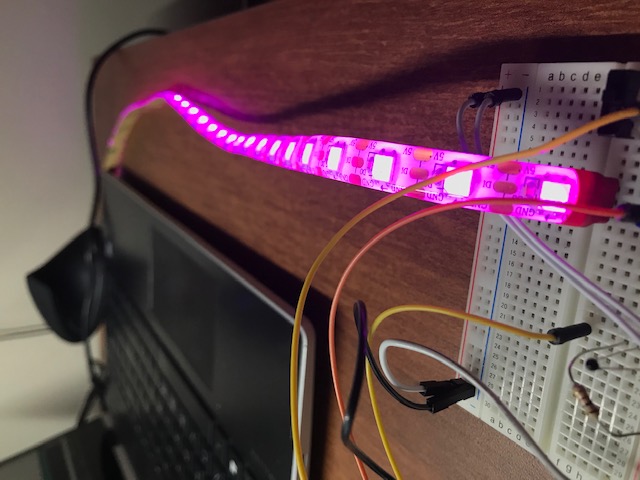
From lowest temperature to highest the colors changes from blue, magenta, yellow,
orange, and finally red. At room temperature my room seems to be in the magenta
area, but when I apply heat to the sensor the values change to reflect a yellow
color.
One challange I faced while trying to implement this display was how to use the values
the sensor collected and convert them into a way to display the data that made sense.
I ended up observing what the starting temperature always was when the sensor first
started off and used that as a baseline. From there, every 10 values was a color change.
Anything below the baseline was the coldest (blue).
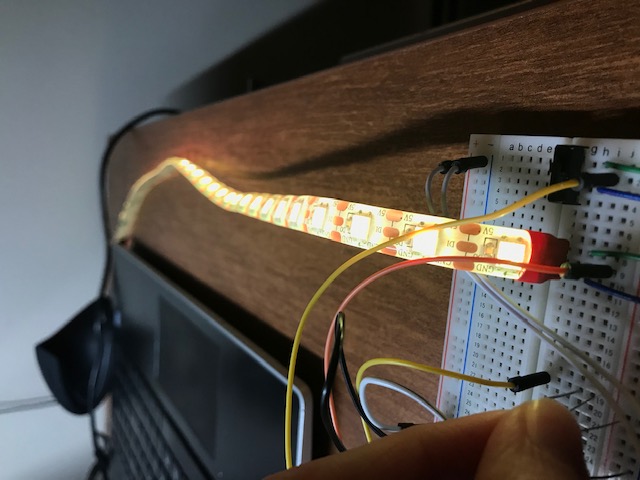
In this video you can see the color changes as the temperature increases or decreases, based on whether I hold my fingers over the sensor or not. It takes a lot of heat to get it up to red, but I was able to get it to orange at the very end.
The second way I displayed the information gathered was through a tick mark
on the LED strip relative to the temperature value. As the temperature increases,
so does the number of LEDs displaying on the strip.
In the same way as the previous display, another challenge here was figuring
out how to display the numbers collected to relate to the 30 pixels I had
to work with. Again I looked to the baseline value and subtracted 90 so it
became a single digit number. From there, any time it changes the LED
display reflects it accurately.
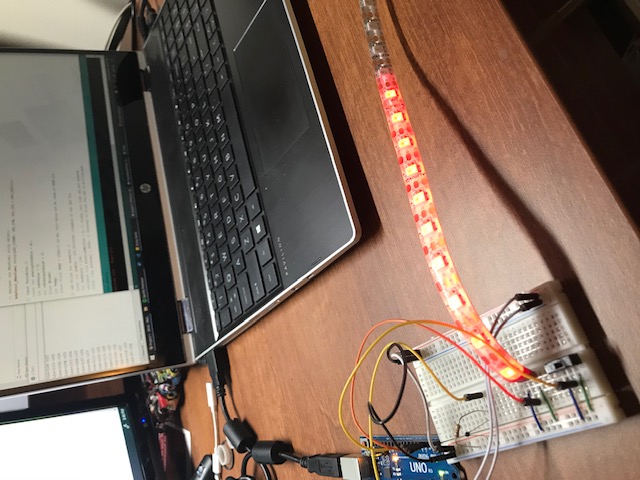
To change over to this way of displaying, the user must flip the switch on the board. In the video you can see how when my fingers are applying heat to the sensor the ticks greatly expand across the strip. When I take my fingers off, the ticks dwindle.
In the future I would love to make the tick mark accurate to a degree or
two of the temperature, like the project I took inspiration from. I would
also love to change from an LED light dipslay to a screen display to
directly print the temperature collected and just use the LEDs to have a
color reflect this temperature.